Featured

Willkommen

For my first post I thought I would tell you a little about myself and my experience in Westchester. My wife and I moved to Westchester in January 2016 after living for years in Santa Monica where we both worked. Living in a cozy apartment, we watched large residential units popping up throughout the City significantly altering its atmosphere and personality. We were eager to move to a residential neighborhood with a diverse culture, engaged residents and reasonable commute to work. After looking for over a year with our great agent Claire Lissone, we found Westchester and have felt increasingly fortunate since moving every day. We were fortunate enough to be able to find a single family residence that was move in ready. A beautiful house we’ve loved from the day we first set eyes on it.
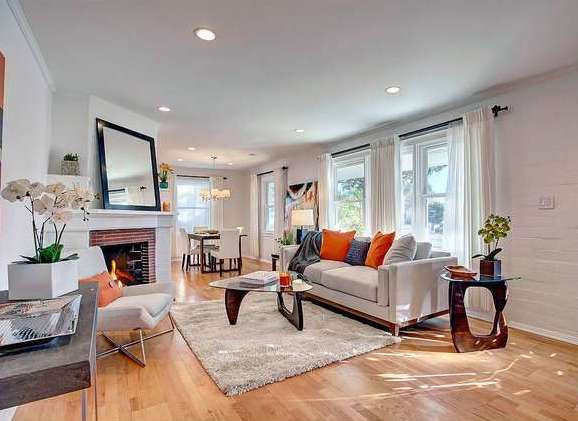
Since moving in, we’ve added solar and converted our gas heater into a heat pump offering air conditioning and heating that is all electric. These are part of a broader theme of mine to try to do our part to tackle increasingly extreme weather conditions.

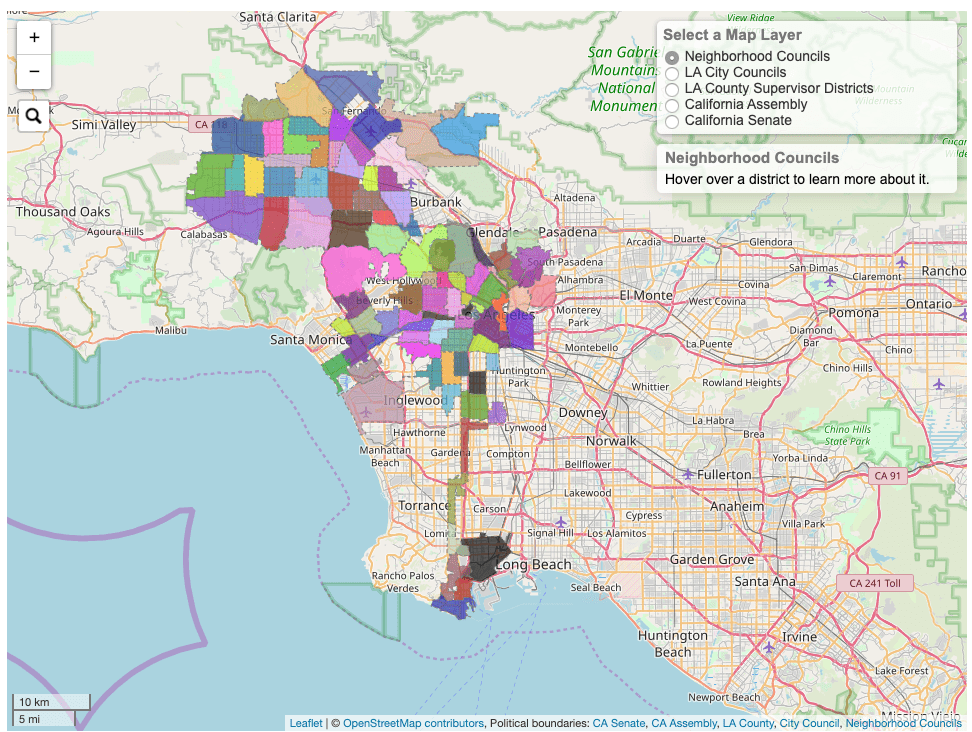
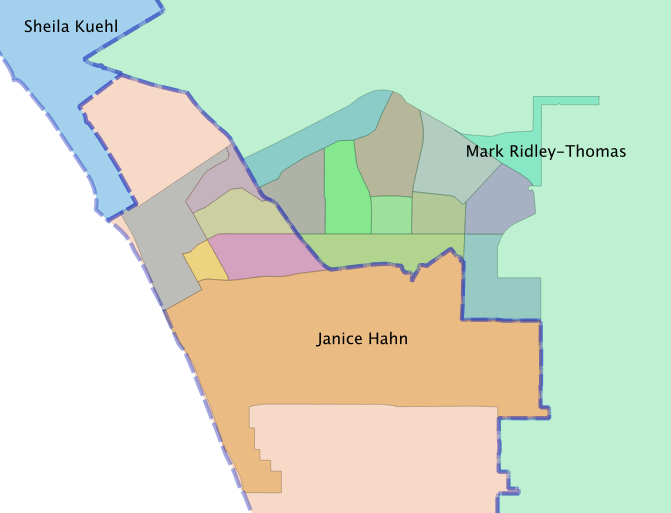
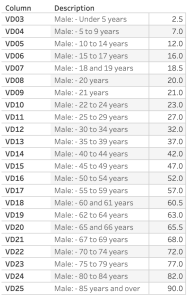
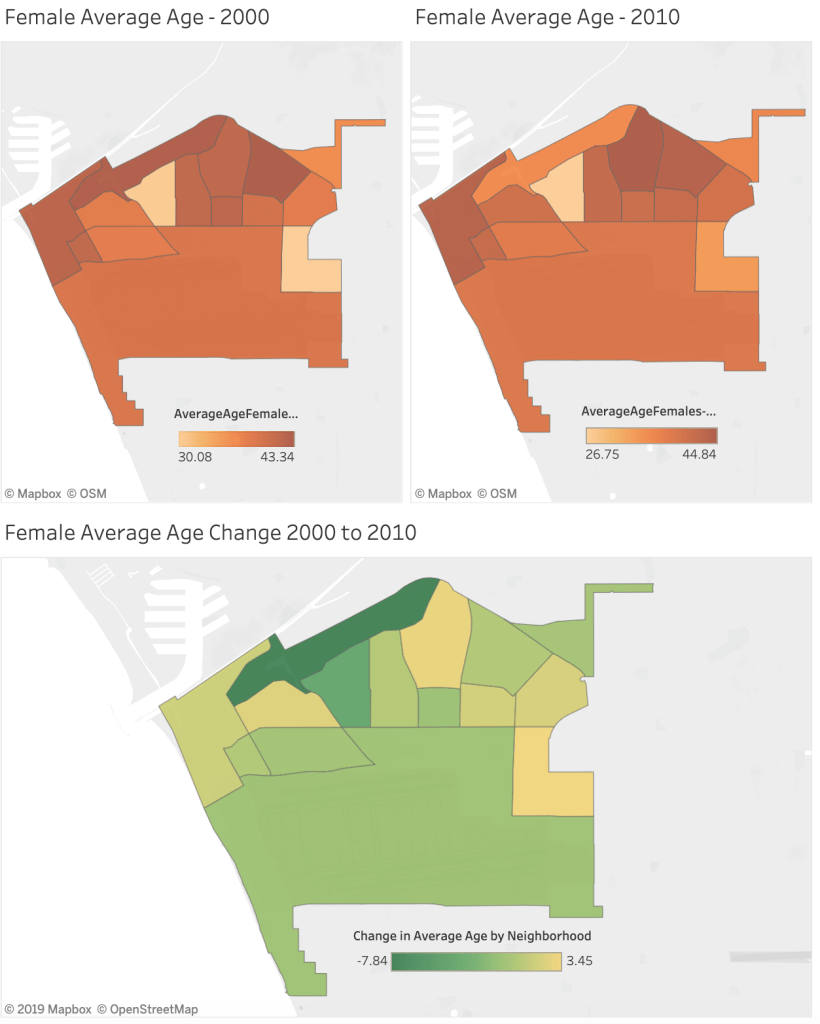
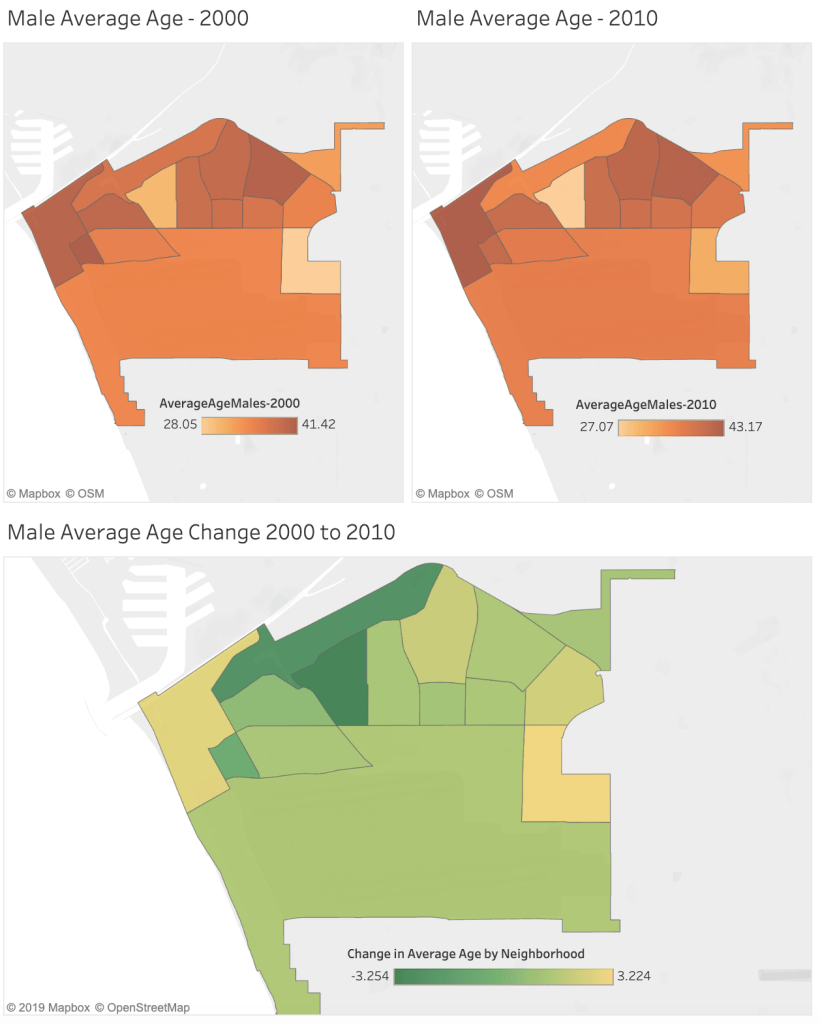
In our search for a new home, I resorted to my early career in geographic information systems (GIS) and developed various maps of the communities surrounding Santa Monica looking at real estate costs, commuting times, crime and safety, access to services and more. Rekindling my excitement for performing geospatial analysis, I found the tools available today have improved remarkably over what was available when I first began. The primary tools in my chest today are an open source GIS desktop software called QGIS and the nimble programming language, Python.

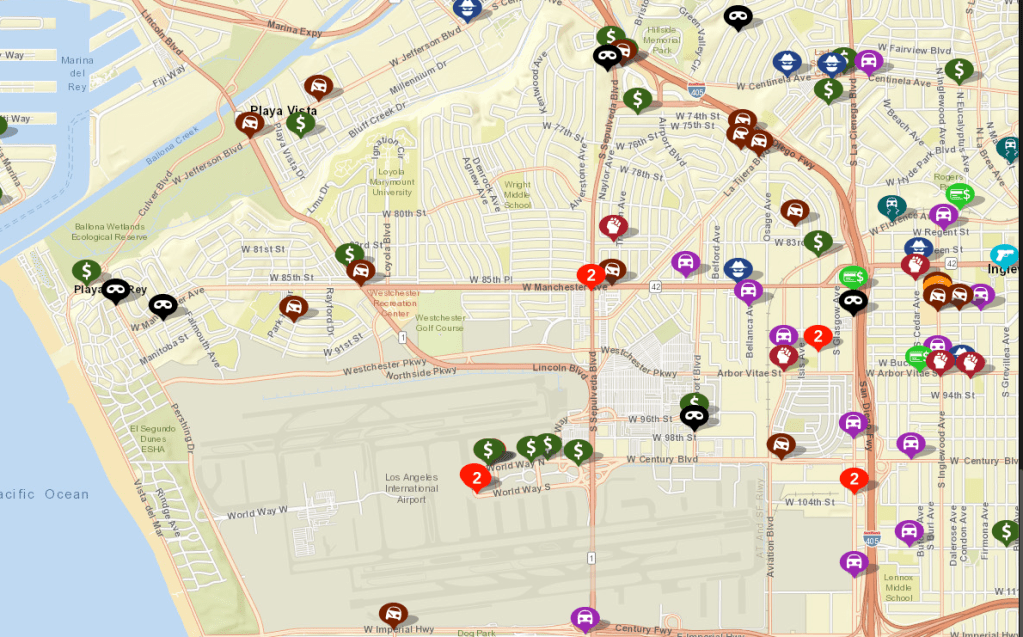
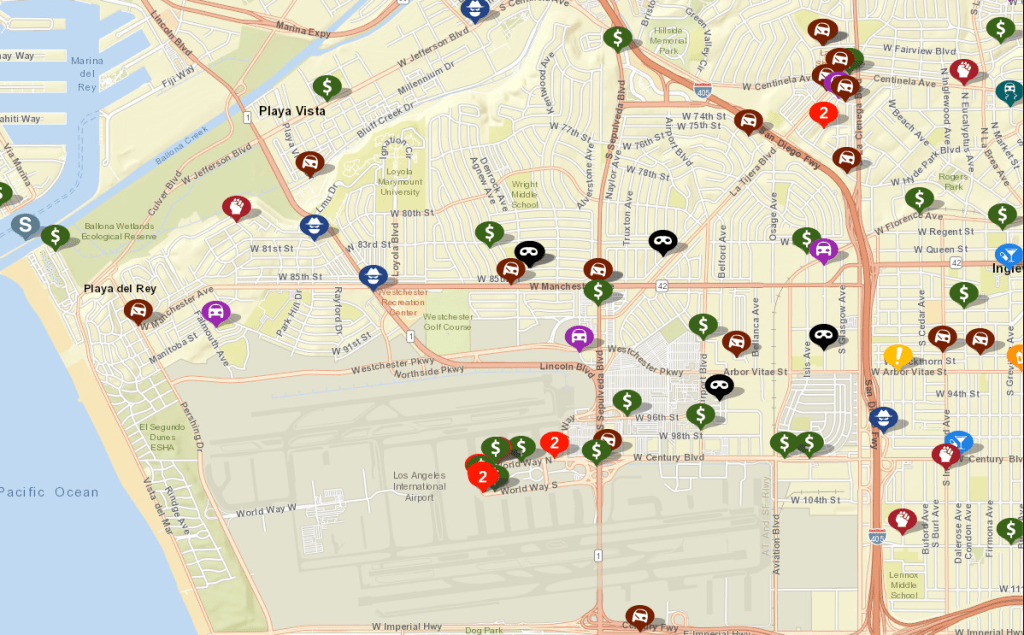
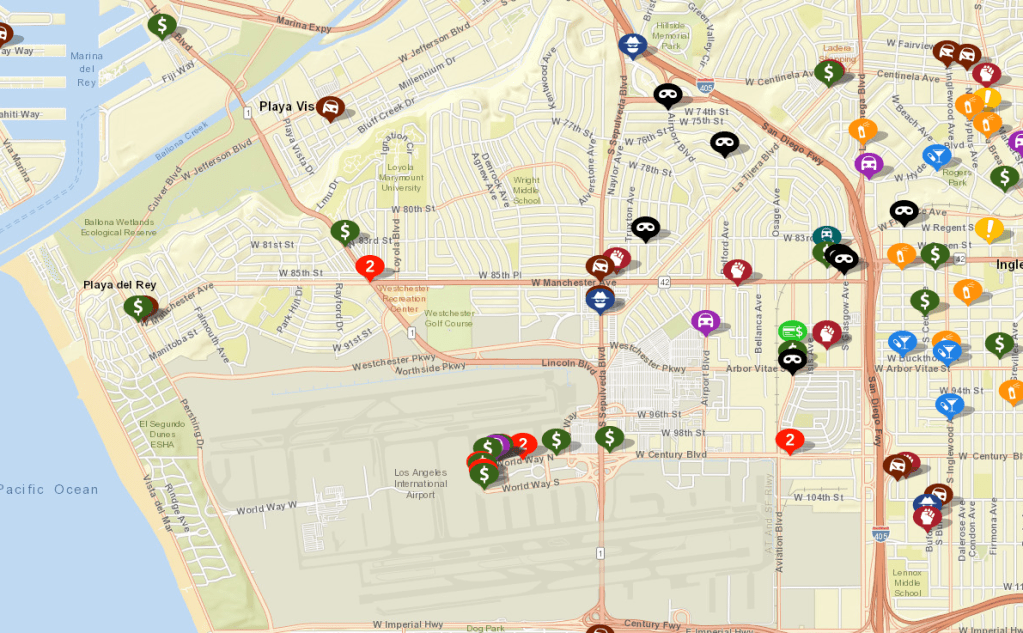
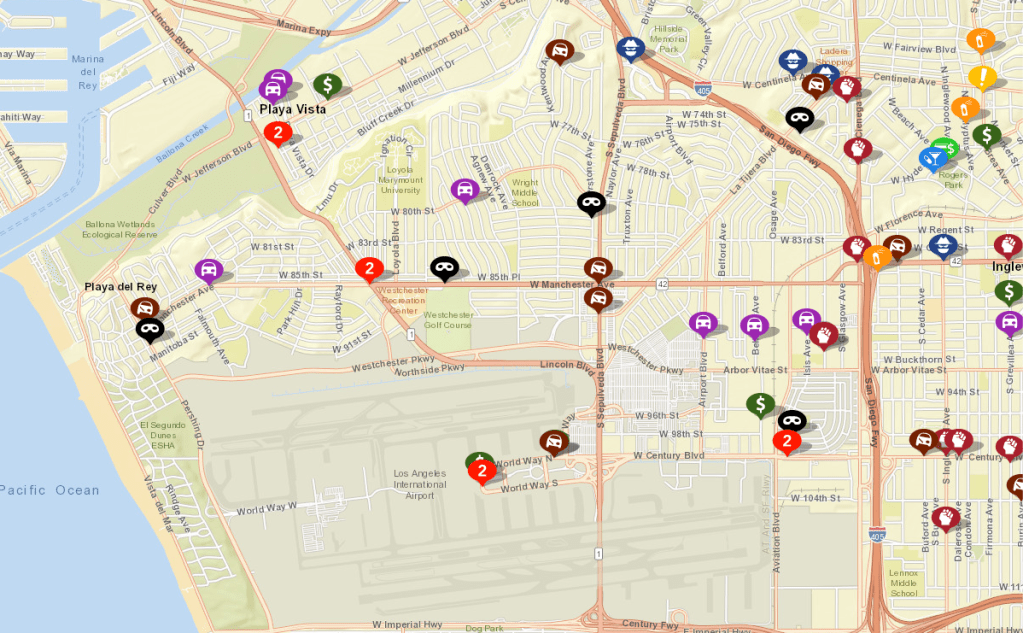
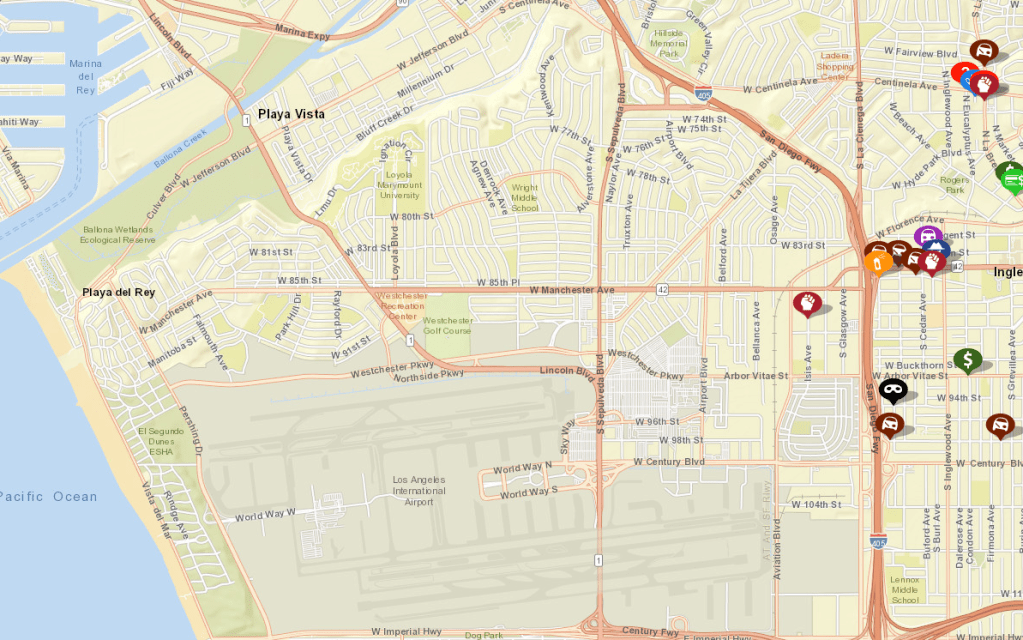
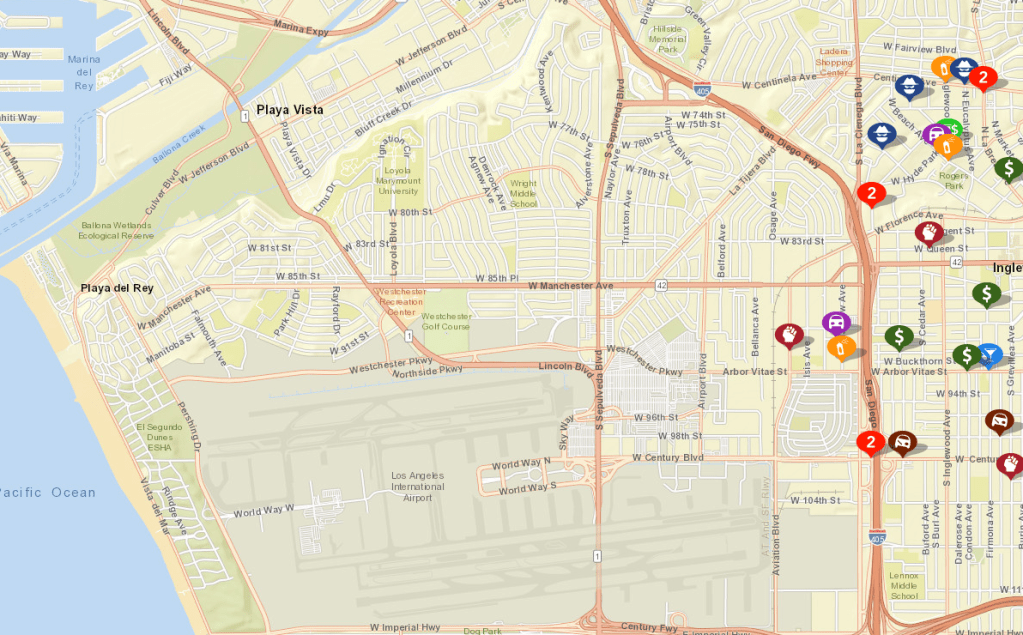
After living in Westchester for a few years I noticed an increase in burglaries in the blocks neighboring our home. I found the Los Angeles crime data mapping website and started tracking these burglaries and found that 6 in a row happened to homes that immediately abutted active or recent construction sites. The website is useful but I thought we could have more meaningful understanding of the patterns and trends with more data. Through a circuitous route, I was introduced to Pat Karasick, the volunteer coordinator for the LAPD (volunteering is a great opportunity for retirees or anyone with free time in their schedule – the department needs all the help they can get). I proposed to her that I’d like to work with the team that does the GIS work in the department. I thought that with additional data one could try to develop predictive models of criminal patterns and behavior to help inform where the very constrained patrol officers should focus their efforts. Unfortunately I learned 2 things: I didn’t have the time to offer the commitment needed during the workday but more problematic was that even in working with the detectives, I could not get access to any more of the data.

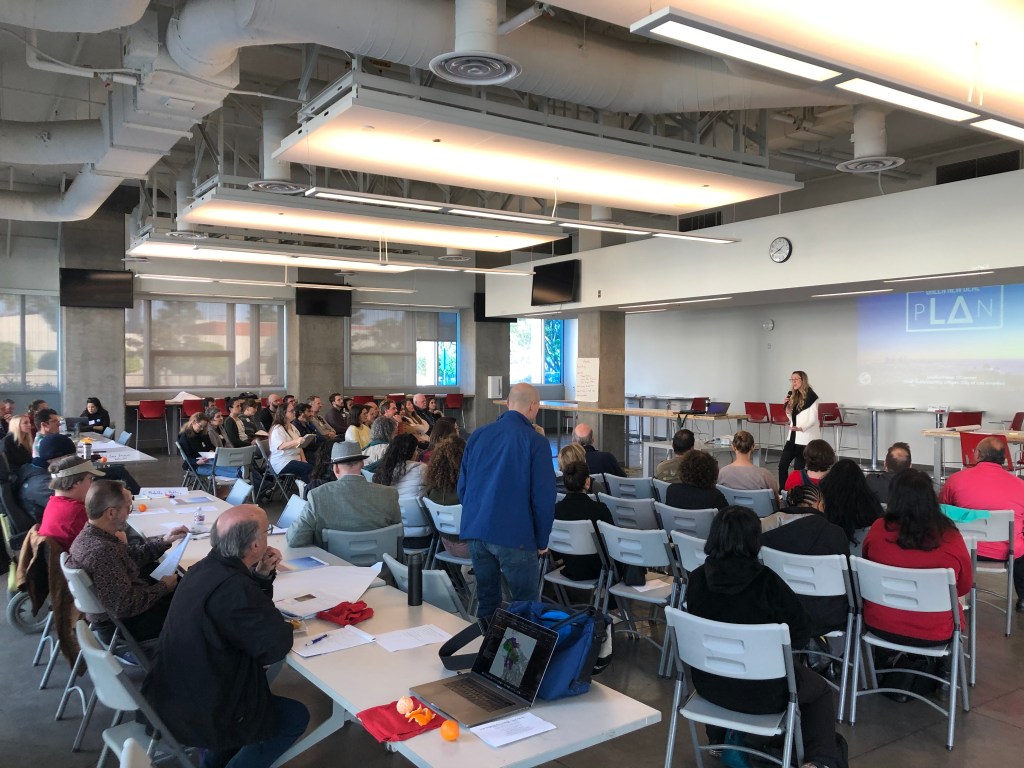
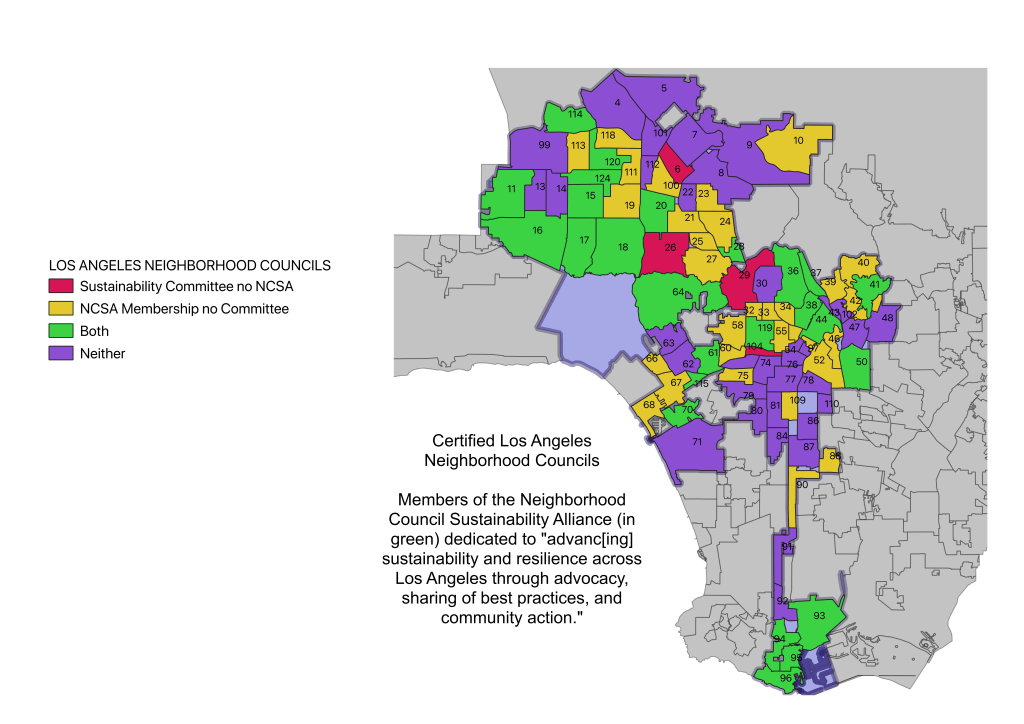
The upside of this experience is that I met several people who eventually steered me to the Neighborhood Council where I wanted to engage in public safety but also became interested in planning and land use. I started attending Planning and Land Use Committee (PLUC) meetings in 2018 where I became more broadly intrigued by the council. Thanks to encouragement by my neighbor, Kimberly Fox, I ran for the District 9 residential district director seat on the board and was elected unanimously in June 2019. Okay, so I ran unopposed, but at least 250 people checked the box next to my name which felt encouraging. So, here I am, a board member on the neighborhood council and sitting on the Outreach, Public Safety and Government Affairs committees where I am learning the ropes working with incredibly selfless people giving service to our community.

Check back in periodically or sign up for an email to be kept up to date with my explorations in data.

Without a Plan

It is undeniable that the City of Los Angeles is in the midst of a housing crisis that has left over 45,000 people without permanent housing, forced to live in their cars, on the street or in tents on the sides of the freeways. Many people have been working tirelessly to address this existential crisis while a very vocal minority have sat on the sidelines and done nothing but assault as inappropriate and even hostile to their ways of life every single effort made by those working on solutions.

For two years I have watched in dismay as proposal after proposal, initiative after initiative was rejected, attacked and even vilified by a small group of people set on preserving their way of life. No feasible or plausible alternatives are proposed.

Prior to 2021, Westchester had never, to my knowledge, had a single homeless shelter, transitional housing or other supportive housing until the City/County recently purchased the Super 8 motel in Westchester to house dozens of homeless, particularly those living in the Westchester Park. Still there are hundreds of homeless living in hostile and inhuman conditions in Westchester / Playa; more must be done yet you reject every effort.

EXTENDED STAY AMERICA HOTEL CONVERSION WOULD OFFER 133 DWELLING UNITS, BUT YOU’VE NOT BEEN HEARD – BUT YOU HAVE

You didn’t want them on your sidewalks, in your alleys or on your lawns.   It was “inhuman to treat them like this” and “they are defecating everywhere” you said. 

You did not want them in your underpasses.  They were “not being treated with dignity” you said.

You did not want them in your parks because you feared for your safety and the safety of your children.

I am not aware of a single housed resident of Westchester who was harmed by a homeless person from the park in the nearly 2 years that the park was a home to 60 to 80 unhoused. To be clear, there were attacks on the homeless in the park, both by other homeless who did not settle into the normative behavior of most of those living there or from gangs preying on the homeless by selling them drugs and extorting money from them.

You did not want them in the municipal parking lot because you feared for the safety of the elderly hoping to visit the senior center.

You said there were drug needles and human feces everywhere in your park.

I do not deny that a needle may have been seen in the park, but I am fairly certain it is impossible to distinguish a needle used for taking Class A drugs from those used for treating diabetes or other similar diseases that disproportionally affect those with poor health care. Add to that, I spent many hours in the park in 2021 including several days in November helping those being moved to temporary housing clean up and organize their belongings. I walked the entire park dozens of times and never saw a needle or human feces.

Needle used for insulin injections
Needle used for injecting heroin

You did not want safe camping or safe parking in your neighborhoods, rejecting every single option explored by the City.

You keep reminding us that you supported the safe parking pilot at the municipal building.  That was 6 spaces in a gated and locked enclosure with concrete walls where you didn’t have to see any of those gaining the benefits of this very supportive service.  They were out of sight and out of mind.  As soon as the apparently successful (we heard from one of the residents of the pilot program how vital it was to her survival) program grew to a space that could support over 25 vehicles in the fenced-in lot to the south of the municipal pool you were suddenly opposed. They were not locked in and you could see them through the chain link fence; no longer out of sight and certainly on your mind.

You are furious at those living in their campers and cars on Jefferson at your wetlands (wetlands that many of you are eager to bulldoze to make into a pristine park), yet, you have rejected every proposed alternative for safe parking in Westchester, Playa Del Rey and Playa Vista.

You point to the “A Bridge Home” in Venice as an abject failure, yet it regularly houses over 100 homeless who would otherwise be in your yards, in your parks or on your beaches. The beneficiaries of the Bridge Home have case workers, receive treatment and have a safe place to sleep for the night, something vital to their recovery.

You did not want them at your beaches, even the beaches that have abundant parking and are very far away from any residential communities.

You have shown no support for tiny homes in CD11. Every proposed site brought forward by the City, County or LAWA have been rejected by you.

You have lamented at the City, County and State spending over $550,000 / unit for fully supportive housing, crying foul that this is all part of a homelessness industrial complex. 

You frequently forget to mention that $550,000 / unit includes the security you so desperately call for and the mental health and substance abuse interventions that you so regularly claim are going ignored. Your refrain is that these programs do nothing to address the mental health/addiction aspect of this problem. But indeed, efforts such as project Roomkey and Homekey are paired with case workers AND health service providers.

AND YET NOW

You are rejecting a program that will take over 100 homeless off your streets, out of your parks, and frankly out of sight. You say that the community has not had a chance to give input into this project. Your voice has been heard. Heard very loudly in social media, your message is consistent. You have not provided a viable alternative to any of the efforts by the City or the County to address the homeless crisis. You just say “not here, not now, no way”. But let’s talk about the Extended Stay America hotel.

  • The property would offer 133 dwellings at a cost of $52M which is roughly $390,000 / unit, much less than the $550,000 / unit the city would spend otherwise,
  • the property is available NOW, to address the homeless crisis today (well, in June),
  • it is not in a residential neighborhood; looking throughout our footprint, notwithstanding the gravel pit to the southeast of LAX, it seems to be one of the best sites for something like this, and
  • it’s an enduring investment the City can sell back to developers when we’ve come out on the other end of this crisis.

YOU HAVE BEEN HEARD

BUT WE NEED ACTION NOW AND THIS IS ACTION

WHAT IS YOUR PLAN?

The 2021 Elections of the Neighborhood Council of Westchester/Playa – Counting the Ballots

A quick article on my experience observing the City Clerk’s office counting the ballots. Given what is involved in hand counting ballots, I not only have a new appreciation for the American election process and the dedication that these clerks have to getting the job right, but also the cost that efforts like recalling well-established politicians impose on the communities they represent. Even such a relatively unknown and underrepresented election such as for the Los Angeles Neighborhood Council, takes days of planning and execution per neighborhood council and there are 99 of these in LA.

I learned that the vote tallies were being streamed on the City’s Zoom channel so I thought I would watch a few minutes here and there to learn about the process. Here are some screen shots i grabbed and notes on what I understood to be going on at each stage.

A step I missed and maybe happens off camera is the opening of the ballot envelopes. They must have some sort of envelope opener that makes that process efficient as they are opening thousands of envelopes per day in some Council Districts.

We start in the morning with a table of ballots with a stack for each of the neighborhood councils in the council district.

The first step is to scan all the ballots into the system. As I understood it from watching, the clerk to the right of the machine stacks a pack of ballots, making sure they are all facing the right way. I would estimate there were 100 ballots in a stack, but I am not certain. She then fed the ballots into the machine that scanned the ballots one-by-one. Our NC ballots have bar codes so that they can be associated with the stakeholder submitting their votes.

With the ballots scanned into the system, another clerk begins the visual confirmation of each ballot.

The clerk flips through each scanned ballot and checks each it against the results that were recorded by the scanner to ensure they matched what was on the ballot. I am not sure what that photographer was doing, but maybe providing additional election auditing documentation, or maybe video for a fascinating documentary on the NC election process.

With the ballots collated, scanned and verified, they are combined in a packet and brought for safe storage in case there are challenges or other concerns with the outcome.

The Venice Bridge Home – Fulfilling its Mission?

A Bridge Home site with Satellite image from Google Maps, CNES / Airbus, Data CSUMB SFML, CA OPC, Maxar Technologies, U.S. Geological Survey, USDA Farm Service Agency

A Bridge Home has helped temporarily house over 230 unhoused people since it opened on February 25, 2020. Of these, about 45 people have transitioned to stable circumstances including permanent housing, family reunifications, self-discharges to live with roommates, and supportive care. Tragically, one resident of the home died of natural causes. We need more solutions like this Bridge Home on the west side of Los Angeles. This is one of many solutions being explored by City Council to address a decades-long issue of increasing homelessness throughout the City.

The housing structure was originally opened with 154 beds in a much-needed area of Venice. Of those, 100 were for adults and 54 for transition-age youth. Since the start of the pandemic, the capacity was reduced to 127 beds with a similar distribution. There have been claims by many opponents that “the bridge housing is not fully occupied“. The home is typically filled to capacity and runs anywhere from 95 to 100% capacity. The distribution of the period of occupancy is bimodal with residents staying either fewer than 30 days or more than 6 months.

The Bridge Home program is not simply a cot and 3 squares. It is an integrated program meant as a piece of the pipeline to flow those living on the streets or in our camps and on the beach into a variety of housing solutions. The Venice Bridge Home is operated by PATH and by Safe Place for Youth. The individuals are matched to the shelter by LAHSA working in partnership with the St. Joseph Center. The Bridge Home is in partnership with a variety of organizations as diverse as Venice Family Clinic, Pals and Pets (veterinary and pet training and care services), The Book Foundation (donated books and running of book clubs for residents), and USA Table Tennis (a certified instructor provided lessons to residents on several occasions early in the pandemic).

Well If It’s So Good, Why So Many Homeless Still on the Streets?

While in any other part of Los Angeles, it would seem that providing housing for that many should make a significant dent on the number of homeless forced to live on the street, subsist on scarce food and remain without health care and other services. Unfortunately, Venice’s long standing homeless problem represents a much greater challenge than housing 125 adults and children. In 2019, there were an estimated 1,100 homeless living in Venice. At best, the home could house 10% of those living on the boardwalk, in alleys and in vacant lots. Venice, like most other communities in Los Angeles, needs 10 Bridge Homes. Unfortunately there is so much resistance to solutions offered by the City that progress is very slow. Obviously A Bridge Home is not the solution for every person living unhoused, but it’s part of a system of systems seeking to end our homeless crisis.

Bonin’s Programs are Causing Homelessness to Flourish

While the data is imperfect and incomplete, here’s a look at the increase in homeless in Los Angeles and CD 11 since 2013. While LA’s homeless population has continuously grown significantly year over year (other than a slight drop in 2018), the homeless population in CD 11 has not increased nearly as much. There was a significant increase in the number of unhoused from 2013 to 2015 but this increase can hardly be blamed on the policies of then recently elected Mike Bonin. From 2015 to 2019, the population of homeless in CD 11 has hovered around 2,500 with the latest count in 2019 recording 2,339.

Data from Los Angeles Homeless Services Authority. https://www.lahsa.org/homeless-count/

This data is from the Los Angeles Homeless Services Authority’s (LAHSA) annual homeless counts. This information raises two questions I don’t have an answer to:

  • Why did all of Los Angeles appear to have reduced its unhoused people from 2017 to 2019 by roughly 6%. Is this a difference in counting methods or a true reduction?
  • Why did CD 11 experience such a dramatic increase in homelessness from 2013 to 2015 (70%)? Was there a massive displacement from neighboring El Segundo or other council districts, did nearly 1,000 new people become homeless in CD 11, or was teh count from 2013 underreported?

Bonin has Failed on His Promises to Venice

Originally proposed in 2018, Council District 11’s Mike Bonin engaged the Venice community with a proposal to acquire the 3 acre facility and build shelter for over 100 homeless. The former transit hub made a lot of sense; it was already fenced in to provide security for the home’s residents, it was large enough to allow for an impactful number of beds along with showers and other supporting services, and it did not require any major construction. Finally, at a cost of only a few million dollars, it was one of the cheapest solutions offered to date. Unfortunately, the community resisted and put up obstacles for nearly 2 years, resulting in 150 people having to continue to sleep on the streets without any care or shelter. Thankfully, they now have protection from the elements and a safe place to rest and protect their belongings.

As part of the Council Motion that established A Bridge Home, the City established the “Special Enforcement and Cleaning Zone“. This is a roughly 2 square mile area surrounding the home’s property that receives special camping and law enforcement attention as well as City-provided sanitation services.

A Bridge Home Special Enforcement and Cleaning Zone and the Bridge Home property in the center

Many residents of Venice and neighbors of the home have expressed great frustration with the outcome of the City’s efforts to house the homeless in their back yards. Questions like “What happened to Mr. Bonin’s promises of frequent cleaning, enforcement against tents, and extra security detail” and comments like “the Venice Boardwalk are [sic] infested with homeless encampments” are not uncommon. Because of COVID and the City’s budget cuts, sanitation services were curtailed throughout Los Angeles. Contrary to these reductions in service, the City continued an elevated cleanup effort in the cleaning zone, visiting the area nearly every day of the week. The area receives spot cleanings on Monday and Wednesday, larger cleanings on Thursday, and additional services on Friday. There is also (outside of the Bridge Home zone but on the street nearby) additional special Sanitation service to the Venice Beach Boardwalk on Fridays. The entire rest of the district has only one day of sanitation service each week focused on encampments.

Indeed, the promises were fulfilled for the Bridge Home proposal.

These encampments are “Havens for the Criminals”

First, please stop misusing the term encampment. Homeless encampments are locations where one or more homeless people live in an unsheltered area. They are uncontrolled organically growing collections of homeless people. Exactly not what the Bridge Home is.

Another overwhelming concern is about the safety of the residents, businesses and tourists visiting Venice. This is another subject with extreme views and where misinformation has spread far and wide; take these choice words emailed to the members of the Neighborhood Council: “skyrocketing crime around the sites, with more broken promises of increased patrol and security” and “crime is escalating because the encampments are now Havens for the Criminals“. I am not sure skyrocketing has been defined in a measurable way but I AM certain that the encampments are not “Havens for the Criminals”.

While crime rates for assault and other misdemeanors have increased in Venice in the areas surrounding the bridge home, they have not skyrocketed. While any assaults are not to be tolerated, they are perpetrated by those living outside the home. The City is tracking the number of crimes reported at the home property and there are very few. This is another example of why the bridge home is an important part of the solution. It provides on site security and a sense of safety to the occupants.

Finally, many have said that the bridge home has increased the number and size of encampments in the areas surrounding the home. The fact is that there were already sizable encampments on both Hampton and Third streets prior to the introduction of the home. There is a new encampment on a section of Sunset Avenue immediately in front of the home. This is because the catchment area for the home, which is all of Venice, has far more people living without housing than the home could possibly house.

Given all that the home has accomplished in its 16 months of operation, I would say it’s a great success and a program that should be extended throughout Los Angeles. Is it without some issues, absolutely not, but it’s at capacity, serving those in need and keeping over 100 adults and youth housed at night and out of your yards and streets.

Housing and Homelessness

It is long past time that Los Angeles take more seriously the housing and homelessness crisis we are in. For too many years, the City has played kick the can with this humanitarian disaster and now the can is in our parks, on our beaches and at our doorsteps. We do this all-too-often: environmental crises, dumping waste into our oceans and sitting idly by as genocide is perpetrated in foreign nations are but a few examples where we continue to turn a blind eye or refuse to address these challenging issues with difficult solutions. Homelessness in Los Angeles is no different.

As one of the over 200 districts and neighborhoods of Los Angeles1, Westchester must do its part in helping to provide solutions to the homelessness crisis. Given the complexity of the crises, the absence of supporting shelters and services in the neighborhood and the growing demand, the sooner we start on a multifaceted approach, the more quickly we will be able to reverse the erosion and begin the recovery. If we continue to defer and hope someone else will address the problem, the problem will only continue to grow out of control. We can no longer wish they were Not In My Back Yard.

A panoramic view of the Westchester Park playing fields on April 16, 2021. Unfortunate gopher holes mark the fields; not likely related to homelessness.

This is the first in a short series of posts I will write to present why I think there are a collection of compelling proposals set forth that we must act on today. I am writing this because I have read a lot of misinformation and lies on social media and more mainstream media related to the causes of our homeless crisis and ineffective responses in Westchester as well as neighboring Venice and Mar Vista.

Councilmember Mike Bonin of Council District 11 represents Westchester in City Council. Mike does not posses executive powers; he is part of a 15-person legislature that must represent the needs of the entire City. Fortunately, this is a Citywide issue, affecting every park, sidewalk and underpass equally. Campers are parked illegally in every community. Because this is a Citywide problem, we must address it with Citywide solutions. We must all bear the burden of the corrective actions that must be taken to right the ills of how we have addressed mental health illness, substance abuse, poverty and race in Los Angeles for decades and longer.

I mention Mike Bonin because he had the courage and foresight to author a motion seconded by Mark Ridley-Thomas, Council File 21-0350, calling for the City to look at a collection of actions to provide shelter to those living on the street: safe camping, safe parking, tiny homes and purchasing hotels and motels. His motion, if passed in Council, will direct the City’s agencies to assess the feasibility of these programs and provide recommendations on viable approaches.

As I mentioned, I have read a lot of mistruths and lies online about the subject of homelessness and Mike Bonin’s proposed response. I plan to do further research and address each of the following questions in greater depth in subsequent posts. Following are some highlights of the issue and the bottom line up front (BLUF):

  • Why are our parks and beaches being targeted? There must be better locations.
    • BLUF: the City has been looking for years without any success; Councilmember De Leon recently introduced a motion in Council File 21-0063 calling on the City to reassess available properties while excluding future uses considerations as has been done in the past. That is a great idea, except the assessment, prioritization, negotiation and clean up of these properties will take months to years. We need a solution now, yesterday.
    • That said, viable suggestions from the community are more than welcome and some have been proposed. Unfortunately the majority of them are not viable options and most would not be a viable alternative for camping because they are no where near the resources needed by the homeless.
  • Why is the City letting people camp in our parks, park for extended periods overnight and sleep on our beaches?
    • BLUF: the City’s hands have been tied by various rulings and now COVID-related relaxation of enforcement2
  • Why are safe camping, parking and tiny homes better than what we’ve been doing?
    • BLUF: these efforts are not better; they supplement other programs such as the HHH housing being constructed all over the City. The benefits of these new efforts are they are adapting the chaotic conditions that exist today into managed offerings that both relieve our communities from the stresses of homeless encampments while being considerably quicker and cheaper to implement than full service housing coupled with reduced disruption to the unhoused. They also represent an element of the flow needed to progressively move homeless residents into more integrated and supportive service offerings.
  • Why isn’t the homeless crisis being addressed with Prop. HHH-funded indoor housing?
    • BLUF: Prop. HHH funding is one part of the solution but is much less an agile solution than is needed.
  • El Segundo and Santa Monica address their homeless problems; why can’t Los Angeles?
    • BLUF: there are several reasons that Los Angeles can neither treat homeless people as poorly as they are treated in other communities to our south and north nor would we want to. More on this soon.
  • The Venice bridge house – is it really a failure from what it promised?
    • BLUF: Venice has long attracted a counter-culture ethos and its homeless problem is far greater than could be solved by one bridge house with 100 beds. It is true that there are many homeless encamped near the bridge house. Many more projects like this are needed to make a serious dent in the local homelessness community.
  • Valley of Hope project in Alexandria Park – why is it a good model for other parks and undeveloped properties in Los Angeles?
    • BLUF: it strikes a good balance between low cost and rapidly deployed solutions with a safe environment in which to house people who can then begin to access services and begin their journey of recovery.
  • If the majority (> 67%) of homeless in Los Angeles suffer from mental illness or substance abuse how can they be let to stay on the streets?
    • BLUF: the statistics on the proportion of homeless that suffer mental illness or addiction vary wildly based on criteria3. Mental illness ranges from mild anxiety (from which many suffer) to various forms of psychoses4. Most importantly, the alternative to “let to stay on the streets” is the criminalization and institutionalization of these homeless. That’s just not acceptable. They need shelter so they can be treated.
  • Cities around the country are shipping their homeless to Los Angeles; aren’t most of the homeless here not from Los Angeles?
    • BLUF: There doesn’t appear to be any reliable source that reports of systemic busing or otherwise shipping their homeless directly to Southern California. Cities do sponsor programs like Homeward Bound that provide homeless with bus fare to return home5.We know that some neighboring cities to Los Angeles enforce homeless evictions that result in their being displaced to Los Angeles, and finally, based on a survey by LAHSA, over 75% of the homeless in LA County are from Southern California6.
  • And then there are the collection of exaggerations:
    • “mentally ill who are unpredictable & oftentimes unsafe & violent” – oftentimes unsafe & violent is absolutely not true – going to hunt down statistics, but I am certain that is not true
    • “APR 14 – 85+ TENTS (An increase of 26 tents in 2 weeks, or an average of +13 tents per week)” – I personally walked the entire park on April 22, 2021 and mapped the location of each and every tent. While far too many tents, there were only 61 tents in and near the park.
    • “transient who was living there who kidnapped a little boy a few years ago” – i believe this refers to an attempted kidnapping by a housed person from North Hollywood7
    • “The park is completely unusable and it’s dangerous” – this is not true; it is used every day by kids playing basketball, playing catch in the fields, adults enjoying the fields and could be used more.
    • “the deaths that occur there” – I am not familiar with any deaths that have been caused by homeless people living in the Westchester Park but I likely have missed something.
Playing basketball in Westchester Park on April 17, 2021. Some tents can be seen in far distance and one tent in the immediate vicinity.

1 https://en.wikipedia.org/wiki/List_of_districts_and_neighborhoods_in_Los_Angeles
2 https://ladot.lacity.org/coronavirus/relaxed-parking-restrictions-extended-july-6
3 https://www.latimes.com/california/story/2019-10-07/homeless-population-mental-illness-disability
4 https://www.webmd.com/mental-health/mental-health-types-illness
5 https://www.vice.com/en/article/bvg7ba/instead-of-helping-homeless-people-cities-are-bussing-them-out-of-town
6 https://la.curbed.com/2019/6/5/18654438/homelessness-los-angeles-other-cities-enforcement
7 https://ktla.com/news/local-news/man-thwarted-by-good-samaritan-charged-in-alleged-attempted-kidnapping-of-boy/

https://news3lv.com/news/local/ticket-home-program-sends-some-homeless-out-of-southern-nevada

https://la.curbed.com/2019/6/5/18654438/homelessness-los-angeles-other-cities-enforcement

Street Safety in Westchester – Part 1

Don’t Pave over the Plan!

I recently learned that elements of the Mobility Plan 2035 will be impacted by StreetsLA’s ADAPT Program. The ADAPT Program seeks to accelerate much needed street resurfacing while there is significantly reduced traffic. Established in 2015, the

Mobility Plan 2035 (Plan) provides the policy foundation for achieving a transportation system that balances the needs of all road users. As an update to the City’s General Plan Transportation Element (last adopted in 1999), Mobility Plan 2035 incorporates “complete streets” principles and lays the policy foundation for how future generations of Angelenos interact with their streets.

Imagine if this could be your local street where pedestrians, bicyclists, joggers and parents teaching their kids how to rollerblade for the first time can safely share the road with local traffic. A scene from Mid City West this past week filmed by a father riding his bike with his children through streets that have been soft-closed temporarily during COVID to allow for safe use of the streets for a variety of activities.

Some of the forward leaning aspects of the Mobility Plan include improving bus lanes to reduce transit times and adding new bike lanes and making existing bike lanes safer. These efforts will serve to reduce the number of cars on the road by making alternative transportation options more appealing through reduced times in traffic and making it all safer for all. The challenge to the Mobility Plan’s implementation is that it requires some negotiation with the local communities, the residences and businesses that border the streets that will be reconfigured, to ensure the implementation is well balanced with their needs. This is a significant improvement over the Road Diet experience we had last year but takes time.

Unfortunately, the StreetsLA ADAPT Program is blazing full speed ahead to take this opportunity, when streets are much less congested with traffic, to resurface streets throughout Los Angeles. These streets are indeed in dire need of resurfacing; pavement is degraded, lane striping is nonexistent and all long overdue for the attention they are getting. With the desire to move quickly, there is a great chance that many of the streets slated for improved bus or bike lanes will be resurfaced with current configuration and may not be re-striped or configured to the goals of the Mobility Plan for many years to come. We will lose out as a community.

In Westchester and Playa Del Rey, one of the major streets planned for improvements per the Mobility Plan that is also slated for much needed resurfacing: Manchester Blvd. Nearly the entire stretch of the boulevard is slated for a dedicated bicycle lane while the section from Sepulveda to Airport is also planned for resurfacing starting in June. It would really be unfortunate if we lost this opportunity to significantly improve the access to and safety of our bicycle lanes (that can also be used to make scooter travel safer).

The data is compiled by StreetsForLA from source materials found in the Mobility Plan 2035 and the ADAPT Program Schedule.

How do you feel about the opportunity to make our streets safer for our children and others in need of more outdoor space? Our neighbors in Palms just to the north voted overwhelmingly in support of a move to create soft street closures.

A survey of the subscribers to the Palms Neighborhood Council mailing list with over 200 respondents show strong support for safer streets.

Who is My Representative

As a recently elected residential district director of the Los Angeles Neighborhood Council of Westchester / Playa representing residential district 9, Westport Heights (North), I quickly realized that I did not know the landscape of policy influencers that affect the lives of stakeholders in our neighborhoods. I was aware that Mike Bonin was the Los Angeles City Council District (CD) 11 representative but little beyond that.

To better understand the intersection of all the influential legislative, deliberative and advocative entities that affect us on a daily basis, I started to collect data on the local, County and State-level agencies in California. I found that at each tier, there were ways to learn “who is my State Assembly representative” but there didn’t seem to be a single place to learn who all the influential forces for a particular area were. I decided to create an interactive map that would allow me and anyone else to find all of the parties interested in a particular address.

Click on snapshot above to explore your neighborhoods. Click on the eyeglass in the top left to enter an address to learn about (e.g., 1233 N McCadden Pl, Los Angeles). All of the representatives that cover the address located are presented below the map.

The representatives I started with were the Los Angeles Neighborhood Councils, LA City Councils, LA County Supervisors and the California House and Senate. I only collected data on the House and Senate members in the greater Los Angeles area but expect to collect the rest soon.

One interesting aspect to all this is how the districts have been drawn up over time. This is important to understand when you are speaking with someone as your neighbor, living in the same zip code or even neighborhood such as Playa Vista, may have a different representative than you for a particular topic. The County Supervisors Janice Hahn (district 4) and Mark Ridley-Thomas (district 2) pretty much bisect Westchester / Playa.

LA County Supervisors Janice Hahn and Mark Ridley-Thomas share representation of Westchester / Playa

It is also important to understand how each of these agencies benefit and influence our daily lives. Many people are not aware that Los Angeles County plays a considerable role in the delivery of healthcare, emergency response, housing and family services, lifeguards at our beaches and the Sheriff’s office. This is important because in many situations such as in working to address chronic homelessness, mental health concerns or housing, the County may play a greater role than the City in providing these services.

And then, beyond these influencers, there are many others. On the coast in Southern California, we have the California Coastal Commission that “in partnership with coastal cities and counties, … regulates the use of land and water in the coastal zone.” We also have the Army Corps of Engineers that in our context “[plan, design, build and operate] water resources and other civil works projects (Navigation, Flood Risk Management, Ecosystem Restoration, Disaster Response, etc.)” such as the Ballona Creek flood control channel.

This was a fun exploration into the capabilities of the Leaflet JavaScript library for creating interactive maps and some extensions that provide additional functionality.

What are other influential agencies and organizations that have a regional presence in the Greater Los Angeles area? Oh wait, what about the Los Angeles Unified School District; on to that next.

Sidewalks and Trees in Westchester

The Willits v City of Los Angeles Settlement from 2014 set in motion a series of events including allocating $1.4 billion by the City of Los Angeles to repair urban sidewalks in the City over a 30 year period that began in 2017. To streamline the process, the City prepared a Draft Environmental Impact Report (EIR) that would establish the procedures, monitoring and responsibilities of various parties in the “sustainable” practice of street sidewalk repair minimizing environmental impact while providing a blanket approach to all projects. The EIR does not go nearly far enough to protect Los Angeles’ urban forest.

File photo by Steve McCrank, Daily Breeze/SCNG
File photo by Dean Musgrove/Los Angeles Daily News)

We must do everything we can to preserve the valuable trees we have today. According to recent studies, US Cities are losing 36 million trees per year1. Los Angeles needs to plant 90,000 trees in the next decade to reduce the temperature, reduce air and noise pollution and improve the aesthetics of the city. The City of Seattle has developed a comprehensive tree management plan that should serve as a model for Los Angeles. The two most important benefits of trees, cooling and cleaning the air, will be lost for a generation at the very time we are in dire need of improving both of these things. A recent study published just how much canopy cover is needed to cool the streets such as Sepulveda; we need much more than we have today.

One of the more contentious issues in repairing sidewalks is the removal of over 12,000 mature trees2 throughout the City’s 9,000 miles of sidewalks. The proposed project plan would see the replacement of these trees at a 2:1 and 3:1 ratio depending on the phase of the 30 year effort. While that seems impressive, in my mind, there are 3 key considerations in understanding the impact of this effort. I will illustrate these considerations with our own local situation: the proposed removal of 6 Indian Laurel Fig (aka, ficus) trees on the east side of Sepulveda Blvd in Westchester between 78th and 79th street.

A 2:1 ratio, covering 2/3 of the project period, seems like we would end up with more canopy cover than we have today; however, based on the species of the trees to be planted, the EIR finds that the replacement trees will only reach roughly 60%3 of the canopy of their replacements at full maturity. So, if all goes according to plan, at maturity we may have slightly more canopy than we do today. One concern is that these replacements may not be planted where the originals were removed; they may be a mile or more away in a location convenient to the contractor.

The second concern is that the trees are estimated to take from 20-30 years to reach maturity with an EIR-estimated 8% mortality rate (the City of Santa Monica’s arborist suggests their mortality rate is closer to 20%). So, for the next 20+ years, we will have considerably less canopy than we do today at a time when we face dire climate conditions with rising temperatures and ongoing air quality problems. Also, tree mortality is generally caused by vandalism, accidents and inadequate climate conditions such as watering; the EIR claims these will be disease free without any substantiating evidence to back that up.

Finally, while the EIR stipulates that trees will be replaced within 1 year of removal and that tree mortality will be monitored for 3 years and replaced if necessary4 (at which point they are considered to be established), there do not appear to be any means to ensure / enforce these standards. I am also skeptical that the urban Forestry Division (UFD) have the resources that some 1,000 tree saplings in various stages of maturity (years 0-3) can be monitored and at what frequency will they be monitored and do we use 311 if we see a tree dying or dead?

So, to understand what is at stake, I turn our focus locally to a very admirable and by all measures successful project managed by the Westchester Streetscape Improvement Association (WSIA) lead by John Ruhlen. Over the past 30 years they are raised an impressive amount of money from local business and other supporters to make improvements to sidewalks and other urban features within Westchester. Unfortunately, recently they have stalled but now seek to finish a section of their project which they claim requires the removal of numerous trees including 6 ficus trees on Sepulveda Blvd between 78th and 79th streets5.

First, a glimpse of what they are removing and what they replace them with. The replacement saplings appear to have a roughly 4 inch diameter with almost no canopy to speak of yet.

A current fig tree on Sepulveda Blvd between 78th and 79th Streets. Image source: Google Street View, April 2019.

One can see that this tree has caused considerable damage to the sidewalk.

One can also see that this tree has a roughly 2,800 square foot canopy (30 ft radius estimated from car length), something that would be lost for over a generation of residents of Westchester and travelers through LAX.
A sapling tree planted by WSIA recently.

This tree has no canopy and will be a decade at least before it does.

As you can see from the images above, these tree removals represent a significant loss of canopy. The loss of canopy results in increased heat in the area, increased air pollution and a loss of nesting habitats for birds, bats and raptors among other things.

What should the City and organizations like WSIA do instead of removing these majestic trees? There are several measures that can be taken for trees that present current or imminent threat of damage to sidewalks. These include easements to route the sidewalk around the current and future root ball, reducing the sidewalk width to 4 feet as allowed by the ADA requirements, creating meandering sidewalks, building bulb-outs (where the sidewalk extends into the current road right of way to be combined with bicycle lanes and other uses) and pruning the tree roots in a manner that will not impair the tree’s health. In the case of the 6 ficus trees, there appears to be ample space to acquire the necessary easements to route the sidewalk around the existing tree growth.

A question remains, how long will these improvements last? If we route a sidewalk around a tree, won’t the roots eventually grow to damage the recently rebuilt sidewalk? Looking at the tree root growth along Sepulveda from 2009 to 2019, the root balls do not appear to have grown substantially if at all. I would need to verify this with an arborist, but my understanding is that they generally reach a maximum vertical growth. It might be that the ficuses on Sepulveda were not planted at the appropriate depth and thus their roots naturally grew up to meet their default size.

A ficus on Sepulveda from 2009 shows some sidewalk damage from its exposed roots. Source: Google Street View, 2009.
The same ficus from 2019. There is no apparent additional damage from the roots of this tree to the sidewalk. Source: Google Street View, April 2019.

The two images above are of the same tree separated by roughly 10 years. One thing that is unfortunate is that it appears the tree in 2019 is not as healthy as the tree from 2009 with many empty branches on its right side. A little further up the street we see another tree with views from 2012 and 2019. This tree also appears to have stopped or at least slowed significantly its impact on the sidewalk.

Ficus tree on Sepulveda Blvd between 78th and 79th Street. Source: Google Street View, 2012.
The same ficus tree from 2019. There does appear to be a little additional damage to the sidewalk on the left side of the tree but the roots do not appear to be growing substantially. Source: Google Street View, 2019.

1https://www.sciencedirect.com/science/article/pii/S1618866717307094?via%3Dihub

2https://sidewalks.lacity.org/sites/g/files/wph661/f/2.0%20Project%20Description.pdf pg 2-31

3https://sidewalks.lacity.org/sites/g/files/wph661/f/3.3_Biology.pdf pg 3.3-29

4https://sidewalks.lacity.org/sites/g/files/wph661/f/2.0%20Project%20Description.pdf pg 2-47

5http://boe.lacity.org/docs/dpw/agendas/2020/202001/20200131/bss/20200131_ag_br_bss_1.pdf

Crime in Westchester / Playa – is it really this quiet?

In preparation for tonight’s Neighborhood Council Public Safety Committee meeting, I wanted to check on the state of crime in our neighborhoods of Westchester, Playa Del Rey and Playa Vista. Having heard of a number of people reporting burglaries in late December, I wanted to check on whether the trends had continued or had abated.

At our last Neighborhood Council board meeting on January 7, we heard from our senior lead officers (SLO) Sophia Castaneda and Luis Pinell that they had some suspects they were pursuing. They described them as 4 african american males wearing ski masks. They were believed to have been responsible for several of the burglaries in Westchester, specifically Westport Heights and Kentwood neighborhoods.

I have come to rely on the CrimeMapping service that offers an easy to use web site where you can search for addresses, filter on specific types of crime and then produce maps and reports based on your search. What is strange is that there do not appear to have been any crimes reported in the new year. According to CrimeMap’s FAQ, the “data we post is gathered with the permission of each agency and is updated on the site once per day.” I have put in an inquiry to CrimeMap to see why the data does not appear to have been updated in the past 2 weeks for Westchester / Playa; it is hard to believe there have been no crimes reported anywhere in 90045.

Given that, here is a look at the last ~6 weeks of crimes in and around 90045. These are from screen shots I took of the map from CrimeMapping website. The first week I looked at, starting on 12/11/19, is what I have generally observed to be the “normal” conditions in our neighborhoods. A collection of theft/larceny undefined and vehicle break-in undefined crimes along with a few vehicle thefts undefined. While still disturbing, my understanding from LAPD and others is that this is a fairly typical urban baseline crime rate.

December 11 – 17, 2019. Roughly 140 crimes reported in this vicinity and slightly beyond (image cropped). — CrimeMapping.com

From the map above, you’ll notice that there were no burglaries in Westport Heights or Kentwood with a few in Playa Del Rey. Also, you’ll see a concentration of theft/larcenies at the airport. Things start to get interesting and unsettling starting the following week, starting 12/17/19 when holiday traveling starts in earnest. While the number of overall crimes in the neighborhood generally stayed level at around 140 in this window and slightly beyond, two things started to change. First, you’ll notice the number and variety of crimes around the airport increased and then there are new burglaries in Westport Heights and Kentwood. The crimes at the airport are likely holiday travelers getting their luggage and other belongings stolen – is this simply because there are more travellers starting to go through the airport or that the pick pockets and luggage thieves have stepped up their game. Hard to say.

December 17 – 23, 2019. Still roughly 140 crimes reported in this vicinity and slightly beyond (image cropped). — CrimeMapping.com

The following week, we see a slight increase in crimes reported and a real growth in burglaries in Westport Heights. This appears to be the start of the crime spree that the 4 suspects went on. You also see the number of crimes in the airport area increase including a vehicle theft.

December 29 – January 4, 2020. Slightly more than 140 crimes reported in this vicinity and beyond (image cropped). — CrimeMapping.com

The burglaries in Westport Heights all occured in the mornings between 8:00 and 11:00 on 12/30 and 12/31. If I recall, at least one of the residents was still in town, so these are not necessarily burglaries that happened at residences where the owners were out of town for the holidays.

One thing to look at with this data would be to compare the burglary locations to construction activities in the neighborhood. I first became interested in these trends last year when i noticed a direct correlation between burglaries in Westport Heights that were adjacent to active or recently completed major home remodeling projects. With access to roofs and back yards, construction crew have unprecedented opportunities to understand the patterns of the occupants and means to break in. This is not to suggest that the construction crews are burglarizing the homes but there is a direct correlation at times. That this year’s burglaries were perpetrated by a team of 4 suggests a different approach.

January 4 – 10, 2020. We start to see a significant drop in reported crimes with roughly 75 crimes reported in the same vicinity. The crimes at the airport have significantly dropped though there are still a handful of burglaries in Kentwood, Playa Del Rey and Osage.

I would have to dig into data from 2018 and 2019, but the trend in crime in the area starts to significantly decline after the new year. Unfortunately, the CrimeMappings service only retains the last 180 days of data. In the first full week of 2020 we see only 76 reported crimes in the area including a reduction in the number of crimes reported at the airport.

January 10 – 16, 2020. There are no crimes reported in Playa Del Rey or Westchester with the exception of one in Osage.
January 16 – 22, 2020. The following week the same seems to be the case with a few in Osage.

So, at tonight’s Neighborhood Council of Westchester / Playa’s Public Safety Committee meeting I will ask our SLOs whether the data is possibly not making it into CrimeMapping’s database or there is some other anomaly going on. Would that we are so lucky that no crimes are occuring in our neighborhoods.

Update on Los Angeles Neighborhood Council Sustainability Alliance

While attending an inspirational event sponsored by the Neighborhood Council Sustainability Alliance (NCSA focusing on how the neighborhood councils could take action to support the City’s Green New Deal, I took a moment to update my data on the growing number of councils that have joined the NCSA.

Before getting into the updates on the state of the NCSA, I thought I’d briefly share my experience at the inspiring, informative and productive Green New Deal event organized by Lisa Hart. It was inspiring because over 90 volunteers from 35 neighborhood councils took a few hours of their Saturday to engage in a variety of discussions covering transportation, waste, clean buildings, water, housing and food topics among others. It was informative because Lauren Faber O’Connor, the Chief Sustainability Officer gave us an update on the City’s efforts across these sectors and it was productive because we broke out into teams and came up with some truly achievable and impactful action plans.

Los Angeles Chief Sustainability Officer, Lauren Faber O’Connor introduces the attendees to highlights from LA’s Green New Deal: Cord Thomas

The objective of the event was for attendees to collaborate on identifying action plans for 10 of the 12 focus areas of the Green New Deal. Following an opening update by Ms. O’Connor and a discussion with Julia Forgie, co-chair of the Los Feliz Neighborhood Council Environmental Affairs committee, describing how they are developing a neighborhood-based action plan in support of LA’s Green New Deal, we broke into 10 teams to brainstorm ideas how each neighborhood could contribute to the City’s efforts. At the end of the very productive and informative event, each team presented highlights from their brainstorming. More on this to come in a future post.

As a side note, I took public transportation to the event. In anticipation of an admonishment by a member of the Los Angeles Eco Village that zero-emission vehicles are “not the solution”, I mapped my route to include the #102 Metro bus and then the Expo (E) and Red (B) Metro trains to the Los Angeles City College campus. I write this because a lot of people have tried public transportation once or maybe twice and dismiss it as a non-viable option; my experience getting there was admittedly frustrating. I missed the #102 by 2 minutes and had to wait 25 minutes for the next bus and then as I was trying to confirm my route, the Expo train left the station. My entire commute to the event took nearly 2 hours whereas on mid-day Saturday, Google estimated my drive would have taken 40 minutes. My return home took 75 minutes due to a greater familiarity with the route and a bit of timing luck in the connections. This is all to say that while public transportation in Los Angeles still has a long way to recover from the street car days, the Metro is well underway to becoming a viable alternative to driving.

Okay, so, now onto a quick update on the NCSA’s membership. A few months ago I wrote that roughly 25 of the 99 neighborhood councils had committees with a focus on sustainability and that there were a little over 50 councils with membership on the NCSA. Since then, the membership has grown another 10% with 57 neighborhood councils having signed on as members. As I did in the previous post, I wanted to understand the relationship of those councils with a sustainability committee to those who are members of the NCSA.

Following is a map showing those councils showing those neighborhoods with a sustainability committee, membership in NCSA, both and neither. There appear to be 4 neighborhoods with a sustainability committee that are not NCSA members: Arleta, Hollywood Hills West, Olympic Park, and Sherman Oaks. Conversely there are 24 neighborhood councils that are members of NCSA that do not have a sustainability committee which suggests a strong commitment to the NCSA.

Looking at Age and Gender in Westchester / Playa

To get a sense of how the neighborhoods of Westchester / Playa have changed over the past 20 years, roughly the time in which the neighborhood council has been certified, I wanted to get a sense of the characteristics of these communities looking at things like demographics, transportation, employment, open space, canopy and beyond. Today I am starting with demographics.

Every 10 years the Census Bureau conducts the decennial census, collecting a wide ranging set of data about households in the United States. To understand how our neighborhoods have been changing, I downloaded the 100% sample file (SF1) from the American FactFinder website by census block for 2000 and 2010 as well as the census block shapefiles for Los Angeles County. I then calculated age and gender aggregates by neighborhood as explained below.

Example of SF1 data on gender bins

The table to the left is a sample of the way the age groups are reported in SF1. This list represents the values for the 2000 males reported by the Census Bureau. To calculate average ages by gender, I assigned an age to each bin, choosing the midpoint of each bin.

I then created several views of the data comparing the females and males in 2000 and 2010 as well as taking a look at how each of the neighborhoods changed from 2000 to 2010.

Click on this image to explore the data in Tableau

In the image above, one sees a fairly significant decline in the average age of the females in Playa Vista. This makes sense as Playa Vista was largely unpopulated in 2000 and since there has been a significant influx of younger residents in large clusters of residential units. In other neighborhoods like Kentwood North and Redding/Ramsgate the female populations have aged slightly.

Click on this image to explore the data in Tableau

In the image above one sees the male trends are quite similar to the female trends with the exception that the males have aged a bit more in Playa Del Rey to the northwest.

Click on the images in the maps above to explore the data in Tableau.

Method

Calculated census block centroids from census block polygons downloaded from the census bureau using QGIS’s Centroids Geometry Tool under the Vector menu. With these in hand I wrote a short PyQGIS script to identify the block centroids that are within each of the neighborhood council boundaries I had previously digitized.

I saved the resulting data into a CSV and loaded it into Tableau. I loaded the neighborhood council boundary shapefile into Tableau and began looking at various characteristics of the residents of Westchester / Playa.

One early look was at the proportion of children (under 18) living in these areas which might inform where child care facilities, schools and other services children need are located today and in the future. More on that for a future post as I ponder how this data could possibly be misused. Here are snapshots of what I learned in that early exploration.

From those two images you can quickly see there are some neighborhoods with very few children (< 10% ratio) and some with many children on average (> 25%). There has been some change over time, but not much.