To get a sense of how the neighborhoods of Westchester / Playa have changed over the past 20 years, roughly the time in which the neighborhood council has been certified, I wanted to get a sense of the characteristics of these communities looking at things like demographics, transportation, employment, open space, canopy and beyond. Today I am starting with demographics.
Every 10 years the Census Bureau conducts the decennial census, collecting a wide ranging set of data about households in the United States. To understand how our neighborhoods have been changing, I downloaded the 100% sample file (SF1) from the American FactFinder website by census block for 2000 and 2010 as well as the census block shapefiles for Los Angeles County. I then calculated age and gender aggregates by neighborhood as explained below.
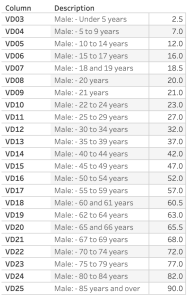
The table to the left is a sample of the way the age groups are reported in SF1. This list represents the values for the 2000 males reported by the Census Bureau. To calculate average ages by gender, I assigned an age to each bin, choosing the midpoint of each bin.
I then created several views of the data comparing the females and males in 2000 and 2010 as well as taking a look at how each of the neighborhoods changed from 2000 to 2010.
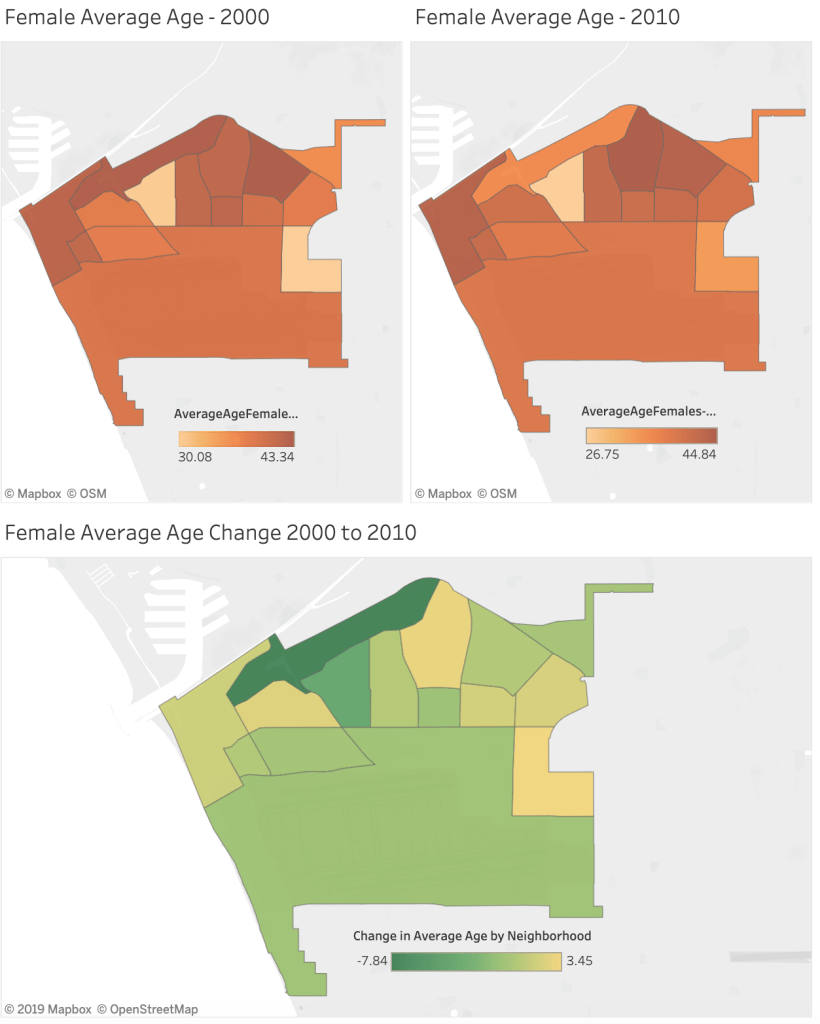
In the image above, one sees a fairly significant decline in the average age of the females in Playa Vista. This makes sense as Playa Vista was largely unpopulated in 2000 and since there has been a significant influx of younger residents in large clusters of residential units. In other neighborhoods like Kentwood North and Redding/Ramsgate the female populations have aged slightly.
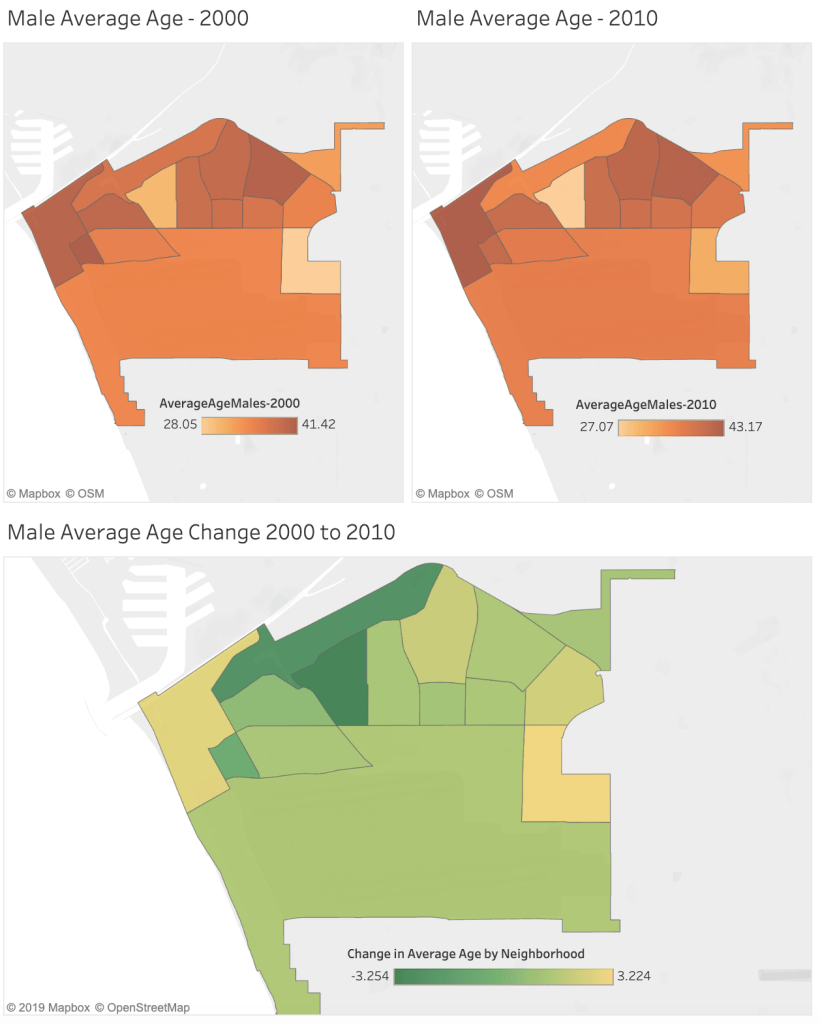
In the image above one sees the male trends are quite similar to the female trends with the exception that the males have aged a bit more in Playa Del Rey to the northwest.
Click on the images in the maps above to explore the data in Tableau.
Method
Calculated census block centroids from census block polygons downloaded from the census bureau using QGIS’s Centroids Geometry Tool under the Vector menu. With these in hand I wrote a short PyQGIS script to identify the block centroids that are within each of the neighborhood council boundaries I had previously digitized.
I saved the resulting data into a CSV and loaded it into Tableau. I loaded the neighborhood council boundary shapefile into Tableau and began looking at various characteristics of the residents of Westchester / Playa.
One early look was at the proportion of children (under 18) living in these areas which might inform where child care facilities, schools and other services children need are located today and in the future. More on that for a future post as I ponder how this data could possibly be misused. Here are snapshots of what I learned in that early exploration.
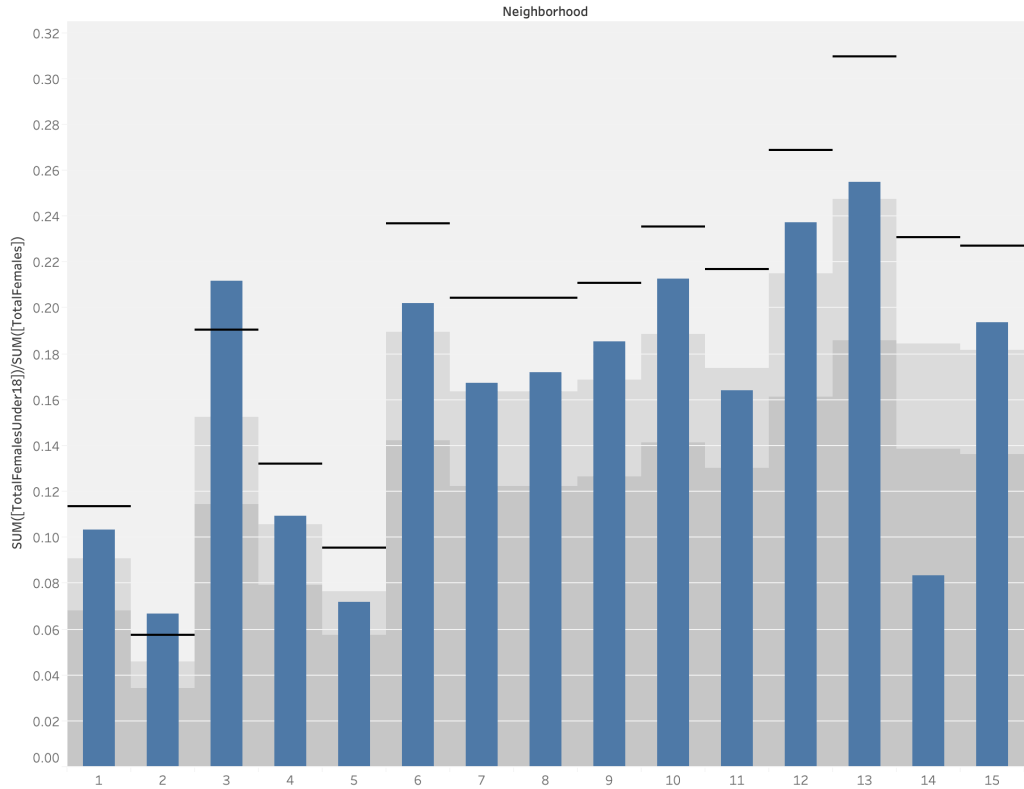

From those two images you can quickly see there are some neighborhoods with very few children (< 10% ratio) and some with many children on average (> 25%). There has been some change over time, but not much.
